
Crypto Profitability Calculator
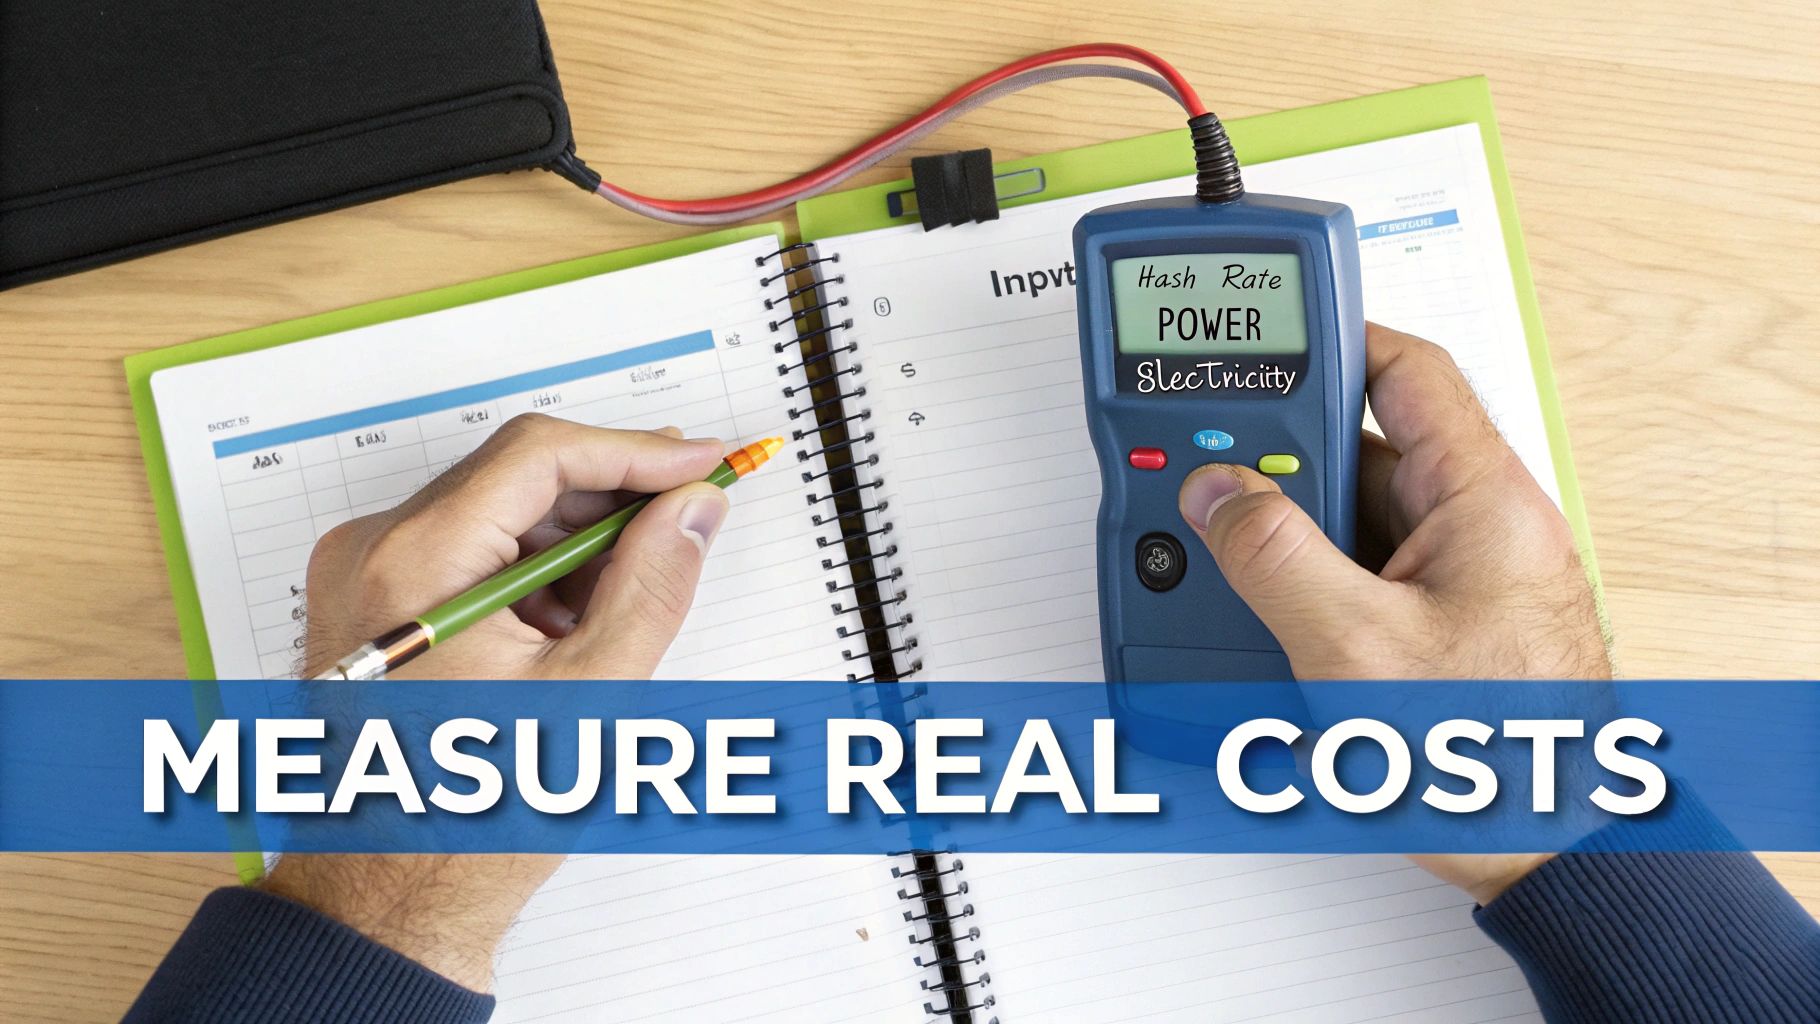
A crypto profitability calculator is an essential tool for any serious miner. It takes key variables—like your hardware’s hash rate, its power draw, and your electricity cost—to estimate what you can realistically earn. Think of it as a data-driven forecast that helps you sidestep expensive mistakes and make sharp decisions on which hardware, coins, and pools to bet on before you spend a dime.
In short, it’s the tool that turns a speculative hobby into a calculated business venture.
Your First Step in Data-Driven Crypto Mining
Jumping into crypto mining without a clear financial forecast is a recipe for disaster. Too many new miners get fixated on the potential revenue from a shiny new ASIC or GPU rig, completely ignoring the variables that actually determine whether they’ll make a profit. This is where a crypto profitability calculator becomes your most important strategic tool.
The goal isn’t just to generate crypto—it’s to do so profitably after every single cost is accounted for. Understanding how your hardware’s efficiency, your real-world electricity rate, and the constantly shifting network conditions all interact is what separates a successful venture from an expensive hobby.
Why Guessing Leads to Losses
The history of mining rewards is a story of extreme volatility. Bitcoin mining profitability, for instance, has been all over the map.
- Late 2015: A miner might have earned just a few cents per Terahash/second (TH/s).
- 2021 Bull Run: That same hash power briefly generated over $0.40 per TH/s daily.
- Post-2021: It has since fallen back below $0.10, according to Statista.com’s analysis.
This volatility shows just how thin the margins can get, making precise calculations absolutely critical.
A tiny change in your inputs—like a 2% pool fee instead of 1%, or a slightly higher stale share rate—can completely wipe out your profit margin when the baseline profitability is already razor-thin.
If you’re just getting started, it’s vital to get a handle on these concepts before you even think about buying hardware. For a great primer on the whole process, from setup to your first payout, check out our guide on how to start crypto mining.

Before you can get a reliable output from a calculator, you need to come prepared with some specific data about your own operation. The quality of your forecast is only as good as the quality of the data you feed into it.
Key Inputs for an Accurate Profitability Calculation
The table below breaks down the must-have inputs for any good profitability calculator. Don’t estimate these—get the real numbers for your setup.
| Input Parameter | What It Means for Your Operation | Why It’s Crucial for Accuracy |
|---|---|---|
| Hash Rate (MH/s, GH/s, TH/s) | The raw processing power or “speed” of your mining hardware for a specific algorithm. | An incorrect hash rate is the most common mistake and will lead to wildly inaccurate revenue projections. |
| Power Consumption (Watts) | The amount of electricity your hardware actually uses when mining at full capacity. | Underestimating power draw directly inflates your perceived profit and can turn a winning operation into a loser. |
| Electricity Cost ($/kWh) | The price you pay for one kilowatt-hour of power, including all taxes and delivery fees. | This is your single biggest operational cost. A small error here can make a profitable rig look bad, or worse, vice-versa. |
| Pool Fee (%) | The percentage of your mining rewards that the mining pool takes as payment for its services. | Fees are a direct cut from your gross earnings. Comparing them is one of the main reasons to use a calculator in the first place. |
In summary: Your first step is clear. Don’t guess. Instead, use a crypto profitability calculator to build a business case grounded in real data. This foundational work will protect you from costly assumptions and set you on a path to sustainable mining.
Mastering the Core Calculator Inputs
Any experienced miner will tell you that a profitability forecast is only as good as the numbers you feed into it. It’s the classic “garbage in, garbage out” problem. Getting these core inputs right isn’t just about plugging in numbers; it’s about finding the real-world figures that reflect your specific operation.
Let’s dig into what these inputs really mean and how to nail them down for a reliable estimate.
Uncovering Your True Hash Rate
Your hash rate is the horsepower of your mining rig—its raw speed at tackling cryptographic problems. The number on the box is a decent starting point, but it’s rarely the full story. In the real world, your actual hash rate is a moving target influenced by a few key variables:
- The Silicon Lottery: No two chips are identical. One might run slightly faster or more efficiently than another right off the assembly line.
- Tuning and Tweaking: Most miners don’t run their gear at stock settings. Overclocking can squeeze out more hash power, while undervolting can save on power consumption.
- Thermal Throttling: If your hardware gets too hot, it will automatically slow down to protect itself. Poor cooling means your average hash rate will be lower than its peak potential.
How to find the right number: Don’t just trust the manufacturer’s spec sheet. The only way is to measure it. Let your rig run for a solid 24-48 hours and check the average hash rate reported in your mining software or on your pool’s dashboard. That’s your number.
Measuring Actual Power Consumption
Power consumption is the silent killer of profitability. Many beginners mistakenly use the wattage listed on the spec sheet, which is often a theoretical maximum, not what the machine actually pulls from the wall.
The only way to know for sure is to measure it yourself. This is non-negotiable.
A simple Kill A Watt meter is one of the best small investments you can make in your mining journey. It takes the guesswork out of your single biggest operational cost.
Plug your entire rig—not just the ASIC or GPU—into the meter and let it run. The number you see on the display is the one to use, as it accounts for everything, including the inefficiency of your power supply unit (PSU).
Calculating Your All-In Electricity Cost
Your electricity rate, usually shown in dollars per kilowatt-hour ($/kWh), is your largest recurring expense. But the rate on the front of your utility bill is rarely what you actually pay. To find your true cost, grab your latest bill and hunt for all the extra line items:
- Delivery fees
- Transmission charges
- Regulatory adjustments
- Taxes and other surcharges
Add up your total bill and divide it by the total kilowatt-hours you used. For example, if your bill is $150 for 1,000 kWh of usage, your true, all-in electricity cost is $0.15/kWh—even if the advertised “supply rate” was just $0.09/kWh. That difference is massive when running hardware 24/7.
Factoring in Hardware Cost for ROI
Finally, any good calculator needs to know your initial investment to project your break-even point and return on investment (ROI). This isn’t just the price tag of the ASIC or the GPUs. Make sure your calculation includes the full stack of components:
| Component | Example Cost | Importance |
|---|---|---|
| Mining Hardware (ASIC/GPU) | $2,000 – $5,000 | The primary investment, directly tied to your hash rate. |
| Power Supply Unit (PSU) | $150 – $400 | A high-efficiency PSU can reduce power waste, lowering long-term costs. |
| Cooling and Ventilation | $50 – $500 | Necessary to prevent thermal throttling and extend hardware lifespan. |
| Racks, Cables, and Misc. | $100 – $300 | These smaller costs add up and are part of your initial investment. |
Key takeaway: Accuracy is everything. Your profit forecast is built on four pillars: measured hash rate, measured power draw, all-in electricity cost, and total hardware investment. Get these right, and you’ll have a reliable financial model.
Advanced Variables That Drive Long-Term Profit
Once you’ve got your hardware specs and power costs figured out, the real work begins. This is where professional miners separate themselves from the crowd—by looking past the static numbers and modeling the dynamic variables that truly shape long-term profitability.
A basic calculation tells you what you might earn today. A sophisticated one helps you forecast what you could be earning six months from now.
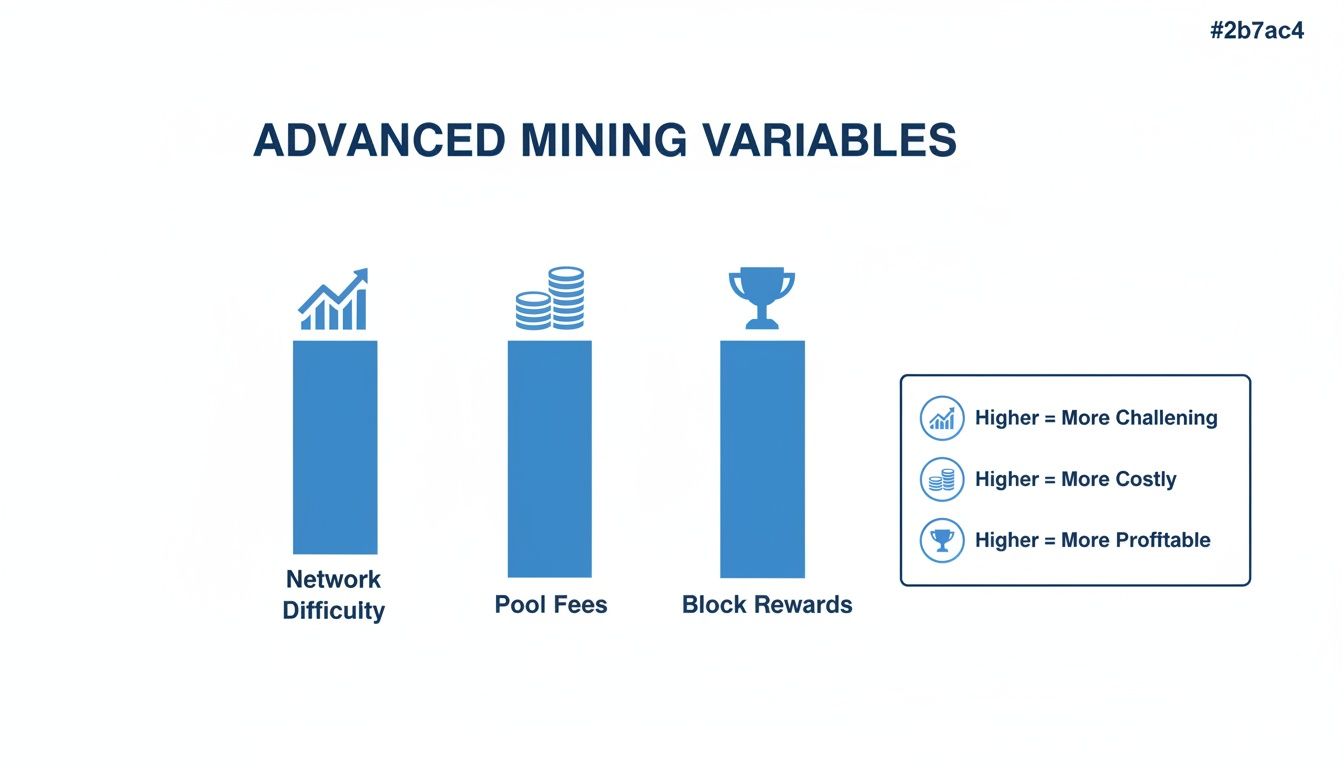
Analyzing Network Difficulty and Block Rewards
Network Difficulty is just what it sounds like: a measure of how hard it is to find a block. This value adjusts automatically based on how much hash rate is pointed at the network. When more miners join, difficulty rises, and your hardware earns a smaller slice of the pie over time.
Likewise, Block Rewards don’t stay the same forever. They’re subject to scheduled reductions called “halvings.” For Bitcoin, this happens roughly every four years, cutting the reward for mining a new block in half.
A rookie mistake is plugging today’s difficulty and block reward into a calculator and assuming they’ll hold steady. A savvy miner, on the other hand, will model a steady increase in difficulty—maybe 1-2% per adjustment period—to create a much more realistic, conservative forecast.
These events can dramatically alter your return on investment. Some industry research found that after the most recent halving, payback periods for rigs like the Antminer S21 stretched out beyond 1,000 days once you factor in the relentless climb in difficulty.
Decoding Pool Fees and Payout Models
Choosing a mining pool isn’t just about finding the lowest fee. The payout model a pool uses can have a much bigger impact on your earnings than a simple 1% or 2% fee difference.
Here’s a breakdown of common models:
- Pay-Per-Share (PPS): You get a fixed payment for every valid share, whether the pool finds a block or not. It’s stable and predictable but usually comes with higher fees because the pool takes on all the risk.
- Pay-Per-Last-N-Shares (PPLNS): You only get paid when the pool finds a block. It’s less predictable day-to-day but can be more profitable in the long run if you stick with a pool that has consistent luck.
- Full-Pay-Per-Share (FPPS): A hybrid model. It pays for your shares (like PPS) and also includes a portion of the transaction fees from the blocks found. This is the go-to model for networks like Bitcoin, where transaction fees are a huge part of the reward.
This table helps visualize the trade-offs:
| Payout Model | Payout Stability | Potential Earnings | Best For |
|---|---|---|---|
| PPS | Very High | Lower | Miners who need predictable, daily income and want to avoid variance. |
| PPLNS | Low to Medium | Potentially Higher | Loyal miners who stick with one pool long-term to benefit from good luck. |
| FPPS | High | High | Miners on networks with significant transaction fees (e.g., Bitcoin). |
The Hidden Costs of Stale Shares and Downtime
Finally, a truly great profitability calculation must account for small inefficiencies. Stale shares are one of them—valid proofs of work that you submit too late, usually because of network lag. A high stale share rate (anything over 2%) is basically wasted electricity.
The screenshot below from MiningPoolStats shows how you can see all this data in one place—fees, hashrate distribution, and other vitals that help you make an informed choice.
Pool uptime is the other big one. If your pool goes down, your rigs are burning power and earning nothing. The difference between 99% uptime and 99.9% uptime is over 80 hours of lost mining time per year. You can learn more about how all these variables factor into the total Bitcoin mining cost in our detailed guide.
In conclusion: To forecast like a pro, you must look beyond your own hardware. By modeling for rising network difficulty, understanding pool payout models, and accounting for inefficiencies like stale shares, you create a far more durable and realistic financial projection.
Putting the Calculator to Work with Real Scenarios
Theory is one thing, but seeing how these numbers play out in the real world is where a mining calculator truly proves its worth. Let’s crunch some numbers for two common setups to show how this tool can guide your decisions.
The goal here isn’t just to compare hardware but to show how a single variable—like your power cost—can make or break your entire venture.
Scenario Analysis: ASIC vs. GPU Mining Profitability
Let’s put a modern Bitcoin ASIC head-to-head with a high-end GPU rig mining a popular altcoin. This side-by-side look will highlight how dramatically the profitability landscape can change.
| Parameter | Scenario 1: Antminer S21 (Bitcoin) | Scenario 2: RTX 4090 Rig (Kaspa) |
|---|---|---|
| Hardware | Bitmain Antminer S21 | Single NVIDIA GeForce RTX 4090 Rig |
| Hardware Cost | $4,000 | $2,000 |
| Hash Rate | 200 TH/s (SHA-256) | 2.1 GH/s (kHeavyHash) |
| Power Consumption | 3500 Watts | 300 Watts |
| Electricity Cost | $0.07 per kWh (Industrial Rate) | $0.12 per kWh (Residential Rate) |
| Daily Power Cost | $5.88 | $0.86 |
| Pool Fee | 1.5% FPPS | 1% |
| Gross Daily Revenue* | ~$20.00 | ~$1.80 |
| Net Daily Profit | $14.12 | $0.94 |
| Hardware Payback Period | ~283 Days | ~2128 Days |
| Revenue figures are estimates based on market conditions at a single point in time and will change. |
As you can see, the high-powered ASIC generates significantly more daily profit, leading to a much faster return on investment. This is the kind of black-and-white data that a calculator provides, moving your decision from guesswork to a calculated financial choice.
Digging Deeper: The Power Cost Factor
Let’s zero in on that Antminer S21. What happens if we plug in a more common residential rate of $0.15 per kWh instead of $0.07?
- Daily Power Cost: Skyrockets to $12.60
- Net Daily Profit: Plummets to just $7.40
- Hardware Payback Period: Nearly doubles to ~541 days
This is a critical takeaway. Access to cheaper power more than doubles the daily profit and cuts the payback period almost in half. It’s the single most important variable for a serious mining operation.
The GPU Miner’s Dilemma: Choosing the Right Coin
The real strength of GPU mining is its flexibility. Let’s see what happens if we point that same RTX 4090 at a different coin, Alephium (ALPH), while keeping our $0.12 per kWh power cost. This is a perfect example of how a calculator helps GPU miners stay agile. If you’re looking for what’s hot right now, our guide on the most profitable crypto to mine is a great place to start your research.
Let’s compare the RTX 4090’s performance on Alephium vs. Kaspa:
- Mining Alephium (Blake3): The rig hits 3.5 GH/s and uses 350 Watts.
- Gross Daily Revenue: Jumps to ~$2.30.
- Net Daily Profit: Rises to $1.29, after the higher power cost ($1.01/day).
- Hardware Payback Period: Drops to ~1550 days.
Despite using more electricity, mining Alephium results in a 37% profit boost over Kaspa in this snapshot. For a GPU miner, that’s a clear signal.
The bottom line: Profitability isn’t a static figure. It’s a moving target influenced by your hardware, costs, and strategic choices. A calculator is the tool that turns these variables into a clear financial roadmap, allowing you to compare scenarios and make informed decisions.
Common Pitfalls in Profitability Forecasting
Getting the inputs right is only half the battle. A calculator is just a tool; it has no judgment. It’s up to you to feed it realistic assumptions and avoid the common traps that lead to overly optimistic projections.
Overlooking Hardware Depreciation
This is the big one. Your shiny new ASIC won’t be the king of the hill forever. New, more efficient models are always around the corner, pushing older hardware down the pecking order and crushing its resale value.
Your calculator might show a fantastic daily profit, but it’s completely blind to the fact that your $4,000 machine could be worth just $1,500 a year from now. You must treat this loss in asset value as a real, tangible cost.
Your mining hardware is a productive asset, but it’s also a depreciating one. Forgetting to account for its declining value is like ignoring your single largest non-electricity expense.
Using Static Difficulty and Price Projections
The crypto market is volatile. Pinning your entire forecast on today’s coin price and network difficulty is a recipe for failure.
- Actionable Tip: Don’t just plug in today’s difficulty. Model a conservative, recurring increase. For Bitcoin, I’d pencil in a 1-2% jump per adjustment period (every two weeks) to get a more believable long-term outlook.
- Price Swings: Never assume the price will just hold steady. Run best-case, neutral, and worst-case scenarios to see how your operation holds up under pressure. This sensitivity analysis is what separates a hobbyist from a serious operator.
Ignoring Hidden Operational Costs
Your power bill is the obvious cost, but it’s far from the only one. A swarm of smaller, “hidden” expenses will eat into your margins if you don’t track them:
- Cooling: Running extra fans or an AC unit isn’t free. This cost needs to be on your balance sheet.
- Maintenance and Repairs: Things break. Fans give out, and power supplies fry. Setting aside 1-3% of your revenue in a dedicated maintenance fund is smart planning.
- Downtime: Your gear will not run 24/7/365. Factoring in a realistic uptime figure, like 99%, makes your forecast much more robust.
The margins in this business can be razor-thin. Recent industry analysis in this Forklog report showed that after the last halving, many large miners found their cost to produce hash hovering dangerously close to the market hashprice. It’s a perfect illustration of how a few small miscalculations can turn a profitable forecast into a real-world loss.
Frequently Asked Questions (FAQ)
What is a crypto profitability calculator?
A crypto profitability calculator is an online tool that estimates the potential earnings from mining a specific cryptocurrency. It uses inputs like your hardware’s hash rate, power consumption, electricity cost, and pool fees to calculate your projected daily, monthly, and yearly profit, as well as your hardware’s break-even period.
How often should I recalculate my profitability?
You should run a full, detailed recalculation whenever a major variable shifts. These are the key triggers:
- Network difficulty changes (e.g., every two weeks for Bitcoin).
- Your electricity rate changes (e.g., seasonal rate adjustments).
- You switch mining pools or coins.
For a quick pulse check, reviewing your numbers every few days is a good habit, especially during volatile market conditions.
Can a calculator predict my exact earnings?
No, and it’s critical to understand this. A mining profitability calculator provides a forecast based on a snapshot in time, not a guarantee. Real-world factors like mining luck, network latency, and unexpected hardware downtime will cause your actual earnings to vary.
A crypto profitability calculator is a compass, not a crystal ball. It points you in the most profitable direction based on current conditions, but you still have to navigate the journey yourself.
What’s more important: a high hash rate or cheap power?
They are two sides of the same coin, and the ideal balance depends on your specific situation. A massive hash rate is useless if your electricity bill consumes all your revenue. Conversely, cheap power is wasted on inefficient hardware. A crypto profitability calculator is the perfect tool to find your sweet spot by modeling different combinations of hardware and power costs to see which yields the highest net profit.
Is crypto mining still profitable?
Yes, but profitability depends heavily on several factors:
- Access to cheap electricity: This is often the single most important factor.
- Efficient hardware: Using the latest generation of ASICs or GPUs is crucial.
- The coin being mined: Profitability varies dramatically between different cryptocurrencies.
- Market conditions: The price of the coin and the overall network difficulty play a massive role.
Mining can be highly profitable for those who can optimize these variables, but it can quickly become unprofitable for those with high costs and inefficient setups. Using a calculator is the only way to determine if it’s profitable for you.