
Crypto Mining Profitability Calculator
Before you even think about plugging in a new mining rig, you need a clear-eyed view of your potential earnings. A crypto mining profitability calculator is the tool for that job. It takes your hardware’s vital stats—hashrate, power draw, electricity cost, and pool fees—and spits out a simple, crucial answer: will you make a daily profit or a loss?
In short, this guide will walk you through exactly how to use these tools, what data you need, and how to interpret the results to make smart, profitable decisions.
Is Crypto Mining Still A Profitable Venture?

Let’s get one thing straight: the days of mining Bitcoin on a spare laptop are a distant memory. Today, profitability is a delicate balancing act, a tightrope walk between hardware efficiency, rock-bottom electricity costs, and the ever-shifting dynamics of the network itself. You’re not just participating anymore; you’re competing, and winning means optimizing every single variable.
The economic ground is constantly moving under a miner’s feet. Here’s what you’re up against:
- The Bitcoin Halving: On April 20, 2024, block rewards were slashed from 6.25 BTC to 3.125 BTC. Overnight, potential revenue was cut in half.
- Soaring Network Difficulty: Shortly after the halving, the network difficulty soared to a staggering 113.76 trillion. This means it’s harder than ever to successfully mine a block.
This one-two punch squeezed profit margins across the board, pushing out anyone not running top-tier hardware with access to incredibly cheap power. You can get more details on these crucial crypto mining industry trends on chainup.com.
The Unforgiving Role of Hardware Efficiency
Modern mining is an arms race. Older hardware doesn’t just get a little less profitable; it becomes obsolete at a blistering pace. The performance gap between a new, high-efficiency ASIC and a model from just a few years ago isn’t a small step—it’s a chasm that separates profit from loss. It’s the difference between a money-making machine and an expensive space heater.
Why is this so critical? Because electricity is a fixed, relentless operational cost. As the network difficulty inevitably climbs higher, only the absolute most efficient rigs can keep hashing profitably.
Key Takeaway: In today’s market, your hardware’s efficiency, measured in Joules per Terahash (J/TH), is arguably more important than its raw hashing power. An inefficient but powerful machine can easily burn through more in electricity costs than it generates in crypto.
Profitability Snapshot: Modern vs. Older Generation ASIC Miner
To see this in action, let’s compare a modern ASIC with an older, once-dominant model. The numbers below assume an average electricity cost of $0.10/kWh and current network conditions, but the principle holds true across the board.
| Metric | Modern ASIC (e.g., Antminer S19 XP) | Older ASIC (e.g., Antminer S9) |
|---|---|---|
| Hashrate | ~140 TH/s | ~13.5 TH/s |
| Power Consumption | ~3010 Watts | ~1323 Watts |
| Efficiency (J/TH) | ~21.5 J/TH | ~98 J/TH |
| Estimated Daily Profit | Positive (varies with BTC price) | Negative (operates at a loss) |
The verdict is brutally simple: investing in outdated hardware is a surefire way to lose money.
This is precisely why a crypto mining profitability calculator is the most essential tool in your arsenal. It lets you run the numbers and model these scenarios before you spend a dime, ensuring your strategy is built on hard data, not hype. It’s the first—and most important—step toward building a mining operation that can actually last.
Getting Accurate Data for Your Calculations
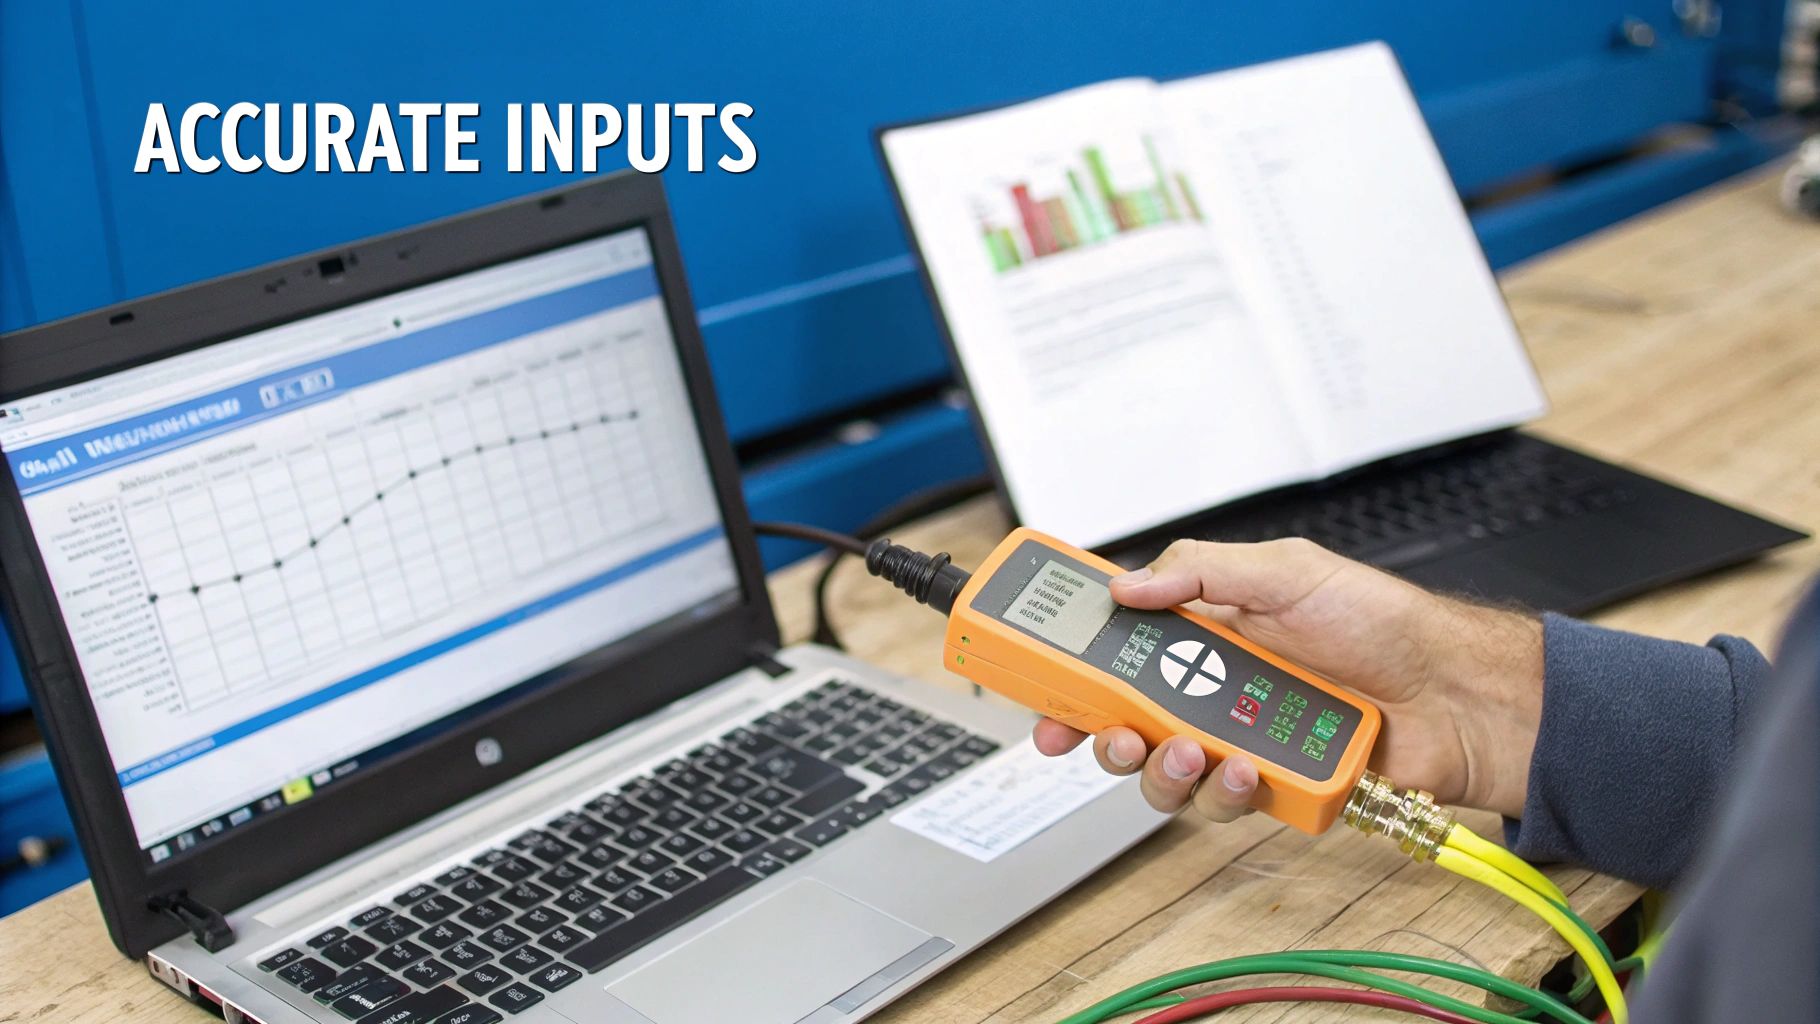
Any mining calculator is only as good as the numbers you plug into it. This is a classic case of “garbage in, garbage out.” If you rely on manufacturer specs or vague estimates, you’ll get a fantasy forecast, not a business plan. Making smart decisions hinges on hunting down precise, real-world data for every single input.
Think of it this way: each variable tells a piece of your financial story, from the raw horsepower of your rig to the nitty-gritty cost of keeping it powered up. Let’s walk through how to lock down accurate numbers for the metrics that truly matter.
Pinpointing Your True Hashrate and Power Draw
The two most critical hardware metrics are hashrate—your rig’s raw computational speed—and its power consumption. The specs on the box are a decent starting point, but they almost never line up with reality.
Your real hashrate can swing based on all sorts of things, like the ambient temperature in your room, the firmware you’re running, or even the specific pool you’ve connected to. The same goes for power draw; the manufacturer’s number is usually an “ideal conditions” figure.
Here’s a simple, two-step process to find out what’s actually happening:
- Measure Power at the Wall. This is the single most important step. Get a simple wall power meter (a Kill A Watt is a popular choice), plug your rig into it, and let it run for at least an hour. This gives you a stable, average reading in watts that reflects your real-world usage. This number is non-negotiable for an accurate calculation.
- Check Your Live Hashrate. Once your miner is connected and hashing away, open your mining pool’s dashboard. It will show you a real-time and, more importantly, an average hashrate over several hours. This is the figure you should use, as it represents what the pool is actually crediting you for.
My Advice: Don’t just measure once and call it a day. Power consumption can shift, especially as a room heats up. I recommend taking a few readings at different times to find a solid average. A seemingly small 50-watt difference can balloon into hundreds of dollars in extra costs over a year.
Calculating Your Exact Electricity Cost
Your electricity cost isn’t just the sticker price per kilowatt-hour (kWh). To get the real number, you have to account for all the taxes, delivery fees, and other line items that bloat your bill. The gap between $0.08/kWh and $0.12/kWh can easily be the difference between a profitable operation and one that’s losing money every day.
Here’s the most straightforward way to find your true, all-in rate:
- Pull up your most recent electricity bill.
- Find the final, total amount you paid.
- Locate the total kWh you consumed for that billing period.
- Divide the total bill amount by the total kWh consumed.
The result is your effective rate per kWh. That’s the number you want for the calculator.
The real-world impact of these variables is massive. For instance, recent analysis of top Bitcoin mining hardware shows an Antminer S19 XP pushing 500 TH/s while drawing 7,450 watts can generate a net profit of around $11.53 daily. But that’s only if electricity costs are $0.07/kWh. You can see more performance comparisons by reviewing these profitability breakdowns on cryptominerbros.com.
Uncovering Hidden Fees and Payout Models
The last pieces of the puzzle are the costs tacked on by your mining pool. Forgetting these can easily throw off your projections by a few percentage points, which adds up fast.
Here’s what to look for:
- Pool Fees: This one is obvious. Most pools charge between 0.5% and 2.5% of your earnings. Find the exact fee for your pool and plug it in.
- Payout Scheme: The way a pool distributes rewards also affects your income. Pay-Per-Share (PPS) offers a steady, guaranteed payout, which is great for consistent cash flow. On the other hand, Pay-Per-Last-N-Shares (PPLNS) is more variable and depends on the pool’s luck finding blocks. While they tend to even out over the long run, your choice impacts short-term revenue.
Tools like WhatToMine are designed for this level of detail, with specific fields for hashrate, power, electricity cost, and fees. By taking the time to gather accurate, real-world data, you turn a simple calculator into a powerful tool for strategic financial planning.
Putting a Mining Calculator to the Test: A Real-World Example
Alright, you’ve got your numbers. Now, let’s see what a crypto mining profitability calculator actually does with them. The output isn’t just a single “profit” figure; it’s a complete financial story. You just have to know how to read it.
We’ll run through a practical scenario using a rig that many serious miners know well: the Bitmain Antminer S19 Pro (the 110 TH/s model). It’s a true workhorse and gives us a solid, realistic baseline for this walkthrough.
Plugging in the Numbers
First things first, we need to feed our data into the calculator. We’ll use competitive, yet totally achievable, figures that a savvy home miner or small-scale operation would be working with.
Here’s the data for our Antminer S19 Pro:
- Hashrate: 110 TH/s (this is the “out-of-the-box” spec)
- Power Consumption: 3250 Watts (you’d get this from a wall meter, not the spec sheet)
- Electricity Cost: $0.08 per kWh (a pretty good rate, and absolutely critical)
- Pool Fee: 1% (a standard cut for a decent mining pool)
When you punch these details into a calculator, it spits out a detailed financial breakdown. Let’s dissect what it all means.
What the Output Is Really Telling You
The results page will throw a lot of numbers at you—daily, monthly, even yearly projections. The trick is to look past the flashy gross revenue and zero in on the net profit. That’s the only number that pays the bills.
Here’s a typical output and how to read between the lines:
| Metric | Estimated Result | What It Really Means |
|---|---|---|
| Daily Revenue | ~$10.50 | This is your gross income before a single bill is paid. It’s pure vanity; never confuse it with profit. |
| Daily Electricity Cost | ~$6.24 | This is the brutal, unavoidable cost of running your rig 24/7. It’s simply 3.25 kW * 24 hours * $0.08/kWh. |
| Daily Net Profit | ~$4.26 | This is the only number that truly matters. After the power company and the mining pool take their slice, this is what you’re left with. |
My Two Cents: Your daily net profit is the bedrock of every other projection. If you’re off by even a penny on your electricity cost, it can completely derail your long-term forecast. Get this part right.
The Long Game: ROI and Break-Even
Daily cash flow is nice, but the real goal here is seeing a return on your investment (ROI). Any good calculator will project this for you, but it’s all built on a massive assumption: that today’s market conditions will last forever.
They won’t. Bitcoin’s price and network difficulty are always moving targets. Think of these projections as a snapshot in time, not a crystal ball.
- Your Break-Even Point: Let’s say you paid $2,000 for this Antminer S19 Pro. With a net profit of $4.26 a day, the math is straightforward: $2,000 / $4.26 ≈ 469 days. That tells you it’ll take well over a year to just earn back your hardware cost, assuming nothing changes.
- The ROI Timeline: Your real return on investment only starts after you hit that break-even point. Every dollar earned from day 470 onward is actual profit.
This example really drives home why these calculators are indispensable. They turn abstract tech specs and power bills into a concrete financial roadmap.
It also helps you shop around for the best mining pools. You can take this data and compare it against other pools with different fee structures. To really drill down, you can analyze a comprehensive list of Bitcoin mining pools on MiningPoolStats to see which ones have the best historical performance and fee models, letting you fine-tune your inputs for maximum accuracy.
Moving Beyond Calculators With Manual Analysis
Online tools are a fantastic starting point for a quick profitability check, but relying on them alone is like navigating with only a compass. To truly master your mining operation, you need to understand the math that powers those calculators. Once you get a handle on the core formulas, you stop being a passive observer and start actively modeling your financial future. This is how you build robust projections and, more importantly, stress-test them against the market’s wild swings.
The whole game boils down to a simple business principle: revenue minus costs equals profit.
This visual drives home a critical point—your gross revenue is only half the story. It’s your operational costs that ultimately decide what you actually take home.
Breaking Down The Revenue Formula
Your daily revenue isn’t pulled out of thin air; it’s a direct result of your mining rig’s power relative to the entire network. The formula might look a bit intimidating at first, but the logic is simple. It calculates your slice of the total daily block rewards based on your hashrate contribution.
Here’s the essential formula for your daily crypto output:
Daily Output = (Your Hashrate / Network Hashrate) * Blocks per Day * Block Reward
You then multiply that output by the coin’s current price to get a dollar value. While calculators handle this automatically, knowing the components helps you understand why your earnings fluctuate. If the total network hashrate suddenly doubles, your piece of the pie gets cut in half, even if your rig is running perfectly.
Calculating Your Daily Operational Costs
The cost side of the equation is far more straightforward but just as important. For most miners, this is almost entirely driven by electricity consumption—a relentless, 24/7 expense.
The calculation is direct and simple:
- Watts to Kilowatts (kW): First, divide your rig’s power consumption in watts by 1,000. A 3,300-watt machine is 3.3 kW.
- Daily Energy Use (kWh): Next, multiply that kW figure by 24 hours. So, 3.3 kW * 24 hours = 79.2 kWh per day.
- Find the Daily Cost: Finally, multiply your daily kWh usage by your electricity rate. If you pay $0.08/kWh, your daily cost is 79.2 kWh * $0.08 = $6.34.
That daily cost, when subtracted from your daily revenue, gives you the net profit. That’s the only number that really matters.
The Real Power Of Sensitivity Analysis
This is where doing the math yourself really pays off. A profitability calculator gives you a static snapshot in time. Sensitivity analysis, on the other hand, lets you game out the future and prepare for volatility by asking “what if?”
This practice involves creating different financial scenarios by tweaking the key variables. It shifts you from a reactive mindset to a proactive one, helping you identify your operational breaking points before you hit them.
Here are a few critical scenarios every serious miner should model:
- Crypto Price Fluctuation: What happens to your daily profit if the coin’s price tanks by 15%, 30%, or even 50%? At what exact price does your operation slip into the red?
- Network Difficulty Increase: Difficulty adjusts roughly every two weeks. Model a 10% or 20% increase to see how it squeezes your revenue share and compresses your margins.
- Electricity Rate Hikes: What if your utility provider raises rates next quarter? Calculate how a seemingly small $0.01 or $0.02 increase per kWh eats into your bottom line.
A Practical Scenario Comparison
Let’s put this into practice. Imagine your baseline projection shows a daily profit of $5.00. Now, we’ll run a few “what-if” scenarios to see just how fragile that profit is.
| Scenario | Variable Change | New Daily Profit | Impact |
|---|---|---|---|
| Baseline | None | $5.00 | Profitable |
| Bear Market | Bitcoin Price drops 20% | $1.80 | Margins shrink significantly |
| Difficulty Spike | Network Difficulty rises 15% | $2.75 | Reduced earnings share |
| Cost Increase | Electricity rate up $0.02/kWh | $3.10 | Higher operational expense |
| Worst-Case Combo | Price -20% AND Difficulty +15% | -$0.45 | Operation becomes unprofitable |
This kind of analysis lays your vulnerabilities bare. In this example, the toxic combination of a market dip and a difficulty jump is all it takes to push a profitable rig into the red. Knowing this ahead of time allows you to plan—maybe you set price alerts to power down hardware or look into securing a fixed-rate energy contract. This forward-looking approach is what separates the hobbyists from the pros.
The viability of mining hinges on these factors. As of 2025, miners are collectively generating around $20 million in Bitcoin daily, but that profit is heavily concentrated among professional operations that can get hardware for $2,000 to $20,000 and secure electricity for under $0.05 per kWh. For a deeper dive, check out the analysis on what makes mining profitable on bitbo.io. By understanding the formulas and running these scenarios yourself, you can navigate this competitive landscape far more effectively.
How Mining Pool Selection Impacts Your Bottom Line

So you’ve run the numbers through a crypto mining profitability calculator and have a solid forecast. That’s a great start, but those projections can fall apart if you pick the wrong mining pool. Choosing where to point your hashrate is a massive strategic decision that directly shapes your income.
Simply picking the pool with the lowest advertised fee is a classic rookie mistake. The reality is much more nuanced. The best pool for you depends entirely on your goals and risk tolerance—are you looking for a steady, predictable daily income, or are you willing to ride out some variance for a potentially bigger long-term payoff?
Decoding Payout Schemes: PPLNS vs. PPS+
The single biggest factor dictating your earnings, right after the fee, is the pool’s payout scheme. The two most common models you’ll encounter are PPLNS and PPS+, and they offer completely different approaches to risk and reward.
Here’s a breakdown of the two main types:
- PPLNS (Pay-Per-Last-N-Shares): Think of this as a performance-based model. You only get paid when the pool actually finds a block, and your payout is proportional to the valid shares you submitted in the time window leading up to that find. It’s a game of luck and probability. Some days you’ll earn more than your calculator predicted; other days, you’ll earn less. Your income can be choppy.
- PPS+ (Pay-Per-Share Plus): This model is all about predictability. You get paid a fixed rate for every single valid share you submit, whether the pool finds a block or not. It provides a guaranteed, stable income stream tied directly to your hashrate. The “plus” means you also get a cut of the transaction fees from any blocks the pool does find, giving you a small bonus on top.
Key Insight: If you’re running a mining operation with real-world expenses like electricity bills, PPS+ is almost always the smarter choice. The predictable cash flow is invaluable. While PPLNS can sometimes yield slightly higher returns over many months if the pool gets lucky, the short-term volatility can be a nightmare to manage.
Using Data to Make a Smarter Choice
Guesswork has no place here. The only way to make an informed decision is by digging into objective, real-world data. This is where dedicated platforms that track pool performance become essential tools in your arsenal.
You need to look at hard numbers—hashrate distribution, fee structures, and historical performance—to truly understand a pool’s health and reliability. You can find this level of granular detail by exploring a comprehensive directory of crypto mining pools on MiningPoolStats, which aggregates the critical data you need to compare options head-to-head.
Factors Beyond the Fee
Once you’ve narrowed down your choices based on the payout scheme, there are a few other operational details that can quietly chip away at your profits. Don’t overlook them.
Here’s a quick checklist of what to look for:
- Payout Threshold: This is the minimum amount of crypto you need to mine before the pool actually sends it to your wallet. A pool with a high threshold, like 0.005 BTC, could mean your earnings are locked up for weeks, especially if you have a smaller setup. I always look for pools with low, or even adjustable, thresholds.
- Server Latency: The physical distance between your rig and the pool’s server really does matter. High latency, or “ping,” increases the risk of submitting stale shares—work that you completed, but too late to count. Always choose a pool with servers located geographically close to you.
- Historical Performance and Uptime: A pool’s reputation is built on consistency. Check their historical hashrate charts. Do you see stable, reliable performance, or are there frequent drops and periods of downtime? Those are huge red flags.
Ultimately, picking a pool is a balancing act. Large, established pools might offer reliable PPS+ payouts but could have higher payout minimums. Smaller pools might tempt you with a PPLNS model and the chance for bigger rewards, but you’ll have to stomach the income variance. By using real data to weigh these factors, you can turn your calculator’s estimate into a real-world profit machine.
Frequently Asked Questions About Mining Profitability
Diving into crypto mining means dealing with a lot of moving parts. To cut through the noise, here are answers to some of the most common questions from new and seasoned miners. Think of this as a practical field guide to help you make sense of the numbers you get from any crypto mining profitability calculator.
How often should I re-check my mining profitability?
You should be checking your numbers weekly, at a bare minimum. If the market is volatile, checking daily is an even better habit. The two biggest variables in any mining calculation—crypto price and network difficulty—are constantly in flux. An operation that looks great on paper today could be losing money by tomorrow. Staying on top of these changes lets you make smart, timely decisions, like when to power down a rig or switch to a more profitable algorithm.
Are online crypto mining profitability calculators accurate?
Yes, but with a major caveat. Online calculators are incredibly accurate for a single moment in time, but only if you feed them precise, real-world data. Their accuracy is a direct reflection of your inputs:
- Your actual hashrate (from your pool dashboard)
- Power draw measured at the wall
- Your true, all-in electricity cost
- Your mining pool’s exact fees
The old saying “garbage in, garbage out” couldn’t be more true here. Where these tools fall short is in predicting the future. They can’t tell you what a coin’s price or network difficulty will be next month. Use a calculator as a snapshot of your current profitability, not a guarantee of future earnings.
What is the single biggest factor affecting my mining profit?
For almost every single miner out there, the most critical factor you can actually control is your cost of electricity. Your hardware’s hashrate is what it is, and you can’t control the market. But your electricity rate, measured in dollars per kilowatt-hour ($/kWh), is a relentless operational cost that eats directly into your revenue. You could have the most powerful miner on the planet, but high energy costs will make it unprofitable. Before buying hardware, your first step should be figuring out if mining is even feasible with your electricity rate.
Do I need to account for hardware depreciation?
Absolutely, yes. Mining hardware is a tool, not a collectible. It’s a depreciating asset with a short, finite lifespan. Every day your rig is running, it’s getting one day closer to being obsolete as newer, more efficient models come out. Most online calculators don’t have a field for this, so you have to track it yourself. A simple, practical way to do this is to set a goal to recoup 100% of your hardware cost within a set timeframe, like 12 to 18 months. The money you make during that period is essentially just paying off the machine. Anything you earn after that is your real profit.
How does the payback period differ from ROI?
It’s easy to mix these two up, but they measure very different things. Getting this right is crucial for understanding how your investment is performing.
- Payback Period: This is all about time. It answers the question, “How long until I make my initial investment back?” Once you hit this milestone, you’ve officially broken even.
- Return on Investment (ROI): This is all about profitability. It’s a percentage that tells you how much you’ve earned relative to what you spent. An ROI of 50% means you’ve earned back your initial investment plus an extra 50% on top as pure profit.
In short, your first goal is to survive long enough to hit your payback period. Your second goal is to generate a positive ROI.